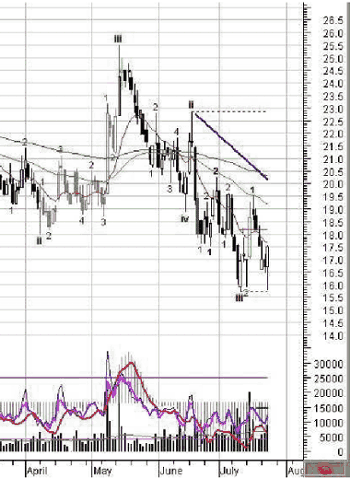
Fig. 26
A trend line will show the direction of the trend for the sensitivity we select. Let's look at the chart. The picture shows a trend line coming from peak of wave ii and moving in the same direction as the bearish trend Exar has undergone since the beginning of the year 2001. The trend line is drawn by the indicator AlphOmega Trendline. It will seek to connect the 2 previous peaks or troughs and draw a line with the same slope as long as there is a confirmation of the trend by a 100 day linear regression of Close (in other words, the slope of this average must negative to connect 2 peaks or the reverse for the troughs).
It will also adjust if there is a missing peak or trough in between, to avoid giving a counter trend direction to the line. It will continue the line until there is a change in the trend. Looking again at the picture, we see that the trend line was not violated. A bullish trend emerged with some volume activity but never crossed. There is an exploration coupled to the trend line (the green wave 1 in July); with it, we can scan the entire database even if we have not inserted the indicator in our template. It will flag for us the violations and the bars since its occurrence. AlphOmega Auto WLR (Wave Linear Regression) is similar but uses linear regression of all prices closing within a user specified number of bars.
Other Indicators
There are many indicators coming with this set, refer to the appendix for a complete list and description.
1. One inherent limit to these Indicators or Experts is caused by the way MetaStock® handles functions that are not defined. Any formula referring to this undefined function becomes undefined and has no value, not even zero; the indicator simply does not show on the graph.
To overcome this, there is a set of indicators that will give us a wave count although the larger order is still undefined. This is done automatically in The Expert Advisor™ but not in The Explorer™ where a special exploration to pick all the securities that are trading in the undefined sensitivity is required. Nowadays we avoid trading the undefined because we could be trading against the trend.
2. To actually display the way a price bar is considered in Elliott methodology, use the Absolute Elliott that will display a red line between all selected highs and lows.
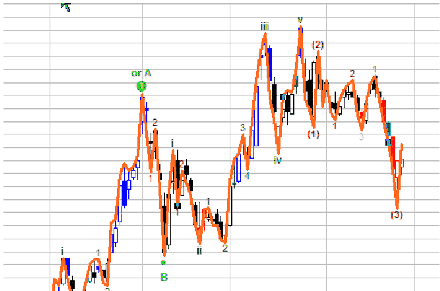
Fig. 27 Absolute Elliott
3. Line indicators such as Automatic Pitchfork, Trend Resistance and Support, Weekly Pivot Point, Gann Angles, Cycles, and Fibonacci Levels are part of the offered selection.
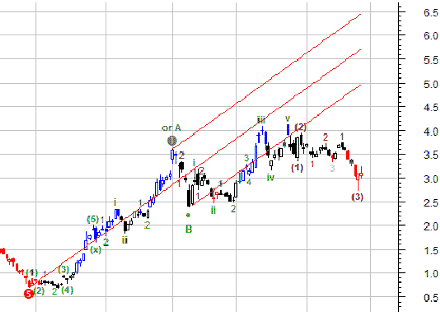
Fig. 28 Pitchfork
The use of the pitchfork is like that of a channel; if the price moves out of the pitchfork, the trend is changing. A good pattern should travel from the external forks towards the middle one then to the opposite fork. In the example, the price trend has reversed when wave (3) diverged from the outside fork. This is not unusual when we are dealing with a C wave. The fork will redraw automatically when the trend change is confirmed by a retracement equal to the sensitivity used. Trend Resistance and Support are like the AO PTF we have seen in the Simple template.
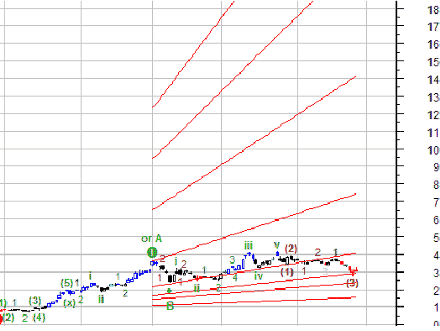
Fig. 29 Gann Angles
The use of Gann Angles is the subject of big books but we will try to simplify; Gann theorized that price was trending according to geometrical patterns, if we draw a square, a price move of 1 unit would consume 1 unit of time, and thus the slope would be a 1X1 ratio. He proceeded then to identify the most common ratios used by price.
Our automatic indicator will compute the slope for 8 of those ratios using the sensitivity to capture the base ratio (1X1) and derive the others from it. So we don’t have to modify the space between bars to make a perfect square, the indicator will adjust the slope to maintain the integrity of the ratio. When price starts straying from the ratio it was aligned with, the trend is changing.
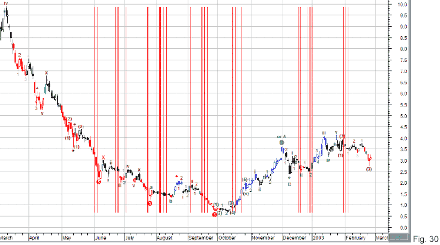
Gann Cycles use a base 8 to divide the progress of a cycle through time. It then seeks to match this length of time to the next waves of the same sensitivity by projecting in time the expected reversal points. Note that the projections for future bars do not display until there is price data for these bars. To display properly, this indicator must be dragged on the chart and when the properties dialog appears, enter the sensitivity, change the style of line to histogram, when asked which scale to use, select none. This will make the histogram float freely in the price pane as displayed above.
Gann related indicators: All indicators referring to Gann levels or angles are not displayed in a way that the geometric relationship is apparent. Gann uses symmetry and geometry to measure price progression. To perceive this relationship, the display should have the horizontal and vertical scales in the expected ratio to form square boxes. However the calculations are correct in spite of the appearance.
Next: Other Indicators
Summary: Index