There are many instances where the wave count will give us an indication of anomaly in the pattern. There are two types of warnings built in the expert. The first type deals with a wave 3 that is shorter than wave 1 and could become the shortest of the pattern. This is against an Elliott fundamental rule and there are good reasons for such rules to exist. There are exceptions but a system should not thrive on exceptions. AlphOmega will warn us by posting the label in light gray for wave 3 and wave 4; this tells us that if wave 5 is not shorter than wave 3, then disregard wave 3 and 4. Wave 5 is probably a wave 3 and you should expect the pattern to continue into a wave 4 and 5. Look at the chart for an example in the ellipse.
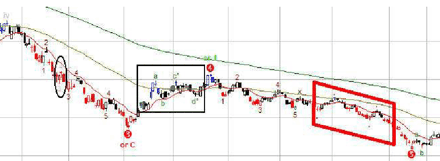
Fig. 65
In the black rectangle, a triangle pattern has been detected and the labels c° and d° appear. They simply mean that the peak at c° is lower than the peak at “a” and the trough at d° is higher than “b”; “a” and “b” are normal waves and the pattern is detected only once c° fails to top “a”. A label e° would have shown if another peak had been lower than c°. In the red parallelogram is an example of how the expert will react to a surge in volatility where the filter will no longer acts properly and will give whipsawed signals. However the next sensitivity will catch properly the end of the wave (As mentioned previously, this feature can be turned off).
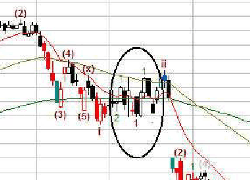
Fig. 66
The second type is for a wave 4 that retraces in wave 1 territory and will display orange bars for as long as the wave can still be labelled as a 4 and is in the said territory. This rule suffers more exceptions than the short wave 3 and for that reason AlphOmega has chosen to use a different form of warning. No example necessary for this one. The next chart is about pattern failure where the count is reset to one. Let’s look at Fig. 66.
The first indication we get that wave 4 may be wrong, is when the price goes into wave 1 territory and then below the trough of wave 2. Since it retraces below wave 2 it is labelled wave 1 in red. The next move is also puzzling as the price moves above the peak of gray 3. The expert reacts by labelling this segment as a green 1 since it matches no other definition. To have two waves 1 in succession tells us the pattern is failing and we should interpret the wave count differently. Hence the correct interpretation is that the two waves 1 cancel each other and the gray wave 3 is ignored. The consequence is that the deploying wave should be a green wave 3. To continue with interpretations, let’s have a look at the next chart.
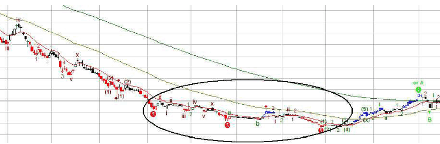
Fig. 67
This last example is an indirect warning that something is foul in the wave count from AlphOmega. We have in the ellipse a succession of x and 5 waves for the largest sensitivity, there should be only one extension. What is happening is caused by the fixed percentage used in the filter. It is obviously off by a few points during this period of high volatility and the threshold for retracement is crossed repeatedly. In the other sensitivities this situation is corrected by checking with the next higher sensitivity and waiting for it to resolve our count.
It cannot be done with the largest unless we delay the initial signals by referring to a higher % filter such as 55%. We went halfway and proceeded to refer to the next filter only for x waves; that explains the red lozenge after the middle 5. When we will see a repetitive wave 5 followed by a lozenge, we will know that we should check manually the next level at 55% to resolve when the pattern will terminate.
Failing to look at the next level could result in a misinterpretation of the market; when volatility goes to such levels, we should pay attention and heed the warning. We should be aware that if the signal comes after a wave 5 extension, the volatility surge has been on going for quite some time and our focus should be on a potential reversal. The above chart is from Nortel and there is no need to say that many were able to jump in the correction that followed.
Next: Three Ways to Use Elliott Waves
Summary: Index