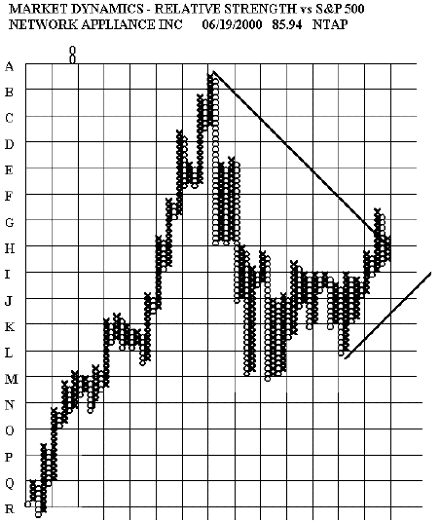
If the Xs and Os on a relative strength point and figure chart were placed by the flipping of a coin – Xs for heads and Os for tails. Using the theory of runs we would be highly suspicious that the coin used to construct the chart was extremely irregular. My tests on many charts indicated far too few runs - which means the coin was crooked. The flips were random but the outcome suggested an underlying process at work and the existence of persistent trends. It is the longterm trends, after all, that we are interested in.
Complex Adaptive System
No functional relationships that last
“ It is statistics not physics” – from Louis Navellier Markets must have uncertainty – No need for a market if there is no uncertainty - because then everyone would agree on price and value. Like evolution in nature - we can understand, describe but can’t predict - Need
to adapt to change as much as predict - Feedback goes both ways – fundamentals to price and price to fundamentals.
For those interested in the implications of Complex Adaptive Systems in the stock market you should visit the Santa Fe Institute’s web site at
Also see Complexity by Waldrop
Also see Dr Brian Arthur’s articles on stock markets.
Next: Some thoughts about portfolio management
Summary: Index