example 1

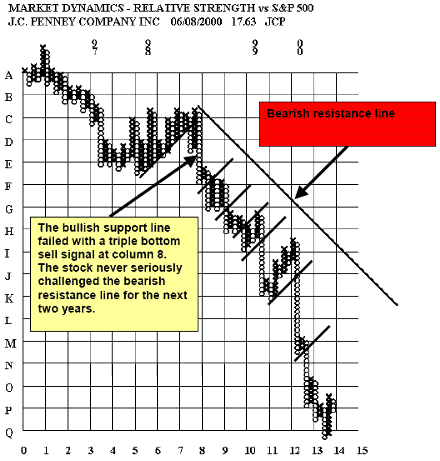
This stock experienced repeated failures of short-term bullish support lines as it declined
example 2

example 3

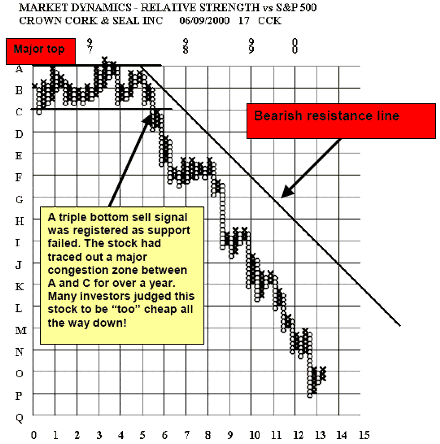
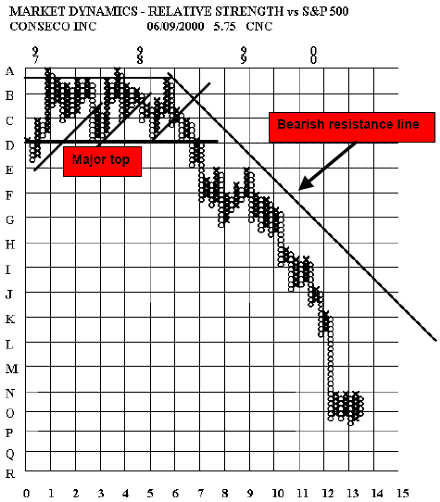
This is another example of a major congestion zone that proved to be a major top and then a long-term decline. In Dollar terms this was a drop from almost $60 to $5. During the topping process several bullish support lines failed to support the stock suggesting the approaching weakness.
By W. Clay Allen CFA
Next: Natural trendlines
Summary: Index