The aim of this paper is to determine the potential profitability of investment strategies based on technical analysis, that could have been applied in the foreign exchange market between January, 2nd 1975 and the present (June, 28th 2004). Thus, there are 7456 daily observations. The focus is on the parity of the US dollar against the currency of Australia, Canada, Japan, Switzerland, and the UK.
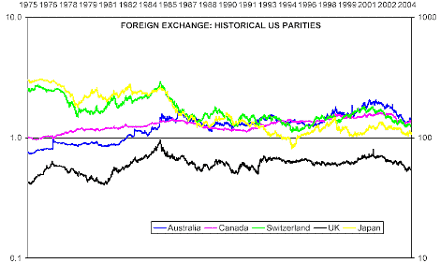
According to The Bank for International Settlements (2002), these parities represent 4%, 4%, 20%, 5%, and 11% respectively of the reported foreign exchange market turnover by currency pair. The US - European currency parity, which represents 30%, is not considered here because begun to trade in 1999. No other parity represents more share than these. Data is from the Bank of England. Disclaimer is accepted. Figure 1 shows the characteristics of the sample. Figure 2 shows the evolution of the parities.
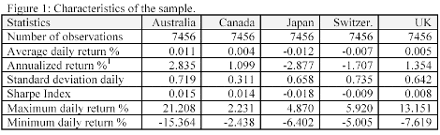
Figure 1: Parities against the US Dollar: Australia, Canada, Japan, Switzerland, and the UK.
Eight simple rules are applied in order to generate investment strategies. They are: simple moving averages (SMA), weighted moving averages (WMA), exponential moving averages (EMA), range trades (RT), filters, relative strength index (RSI), Lane %K statistic, and the Williams %R statistic. The strategies are applied on the historical data and only the long positions are tracked and reported. For each analyzed strategy, it is reported: the number of trades that the strategy generates; the total average return per trade; the average number of days in the trade, the annualized average daily return, and the corresponding Sharpe index.
In order to compare the consistency of the rules, each strategy is compared with a simple buy and hold strategy (indexation). Additionally, R2C represent the coefficient of determination in a regression between the daily return and a dummy variable (1: if a buy signal arise and 0: if not). Finally, the return in excess applicable to commissions is computed as the differences between the average return and the return of the index, divided by the number of roundtrip2 trades minus 1, that one equivalent to the indexation.
1 In order to compute annualized daily return, 252 days are introduced into the formulae. This is because; the average number of trading days in a year is 252.
2 A round trip is a move from a long position to a short position and back or vice-versa.
Prof. F. Rubio
Next: Results
Summary: Index