Detailed simulation results are tabulated by country in appendix Tables A1 and A2. Table A1 reports the results of simulations of the swap-swaption scheme in which interventions are tied to scheduled debt service while Table A2 reports simulations of the unconstrained scheme in which interventions are related only to a moving average of (lagged) export revenues constrained only by the cap and floor .
For each country and both hedging schemes, results are provided for each of the swap-based scheme (scheme A) and the swaption scheme (scheme B) using a ±15% threshold.
The simulation results reported in Tables A1 and A2 differ markedly across countries but are fairly consistent across alternative schemes in any given country. These differences across countries motivate consideration of average benefits.
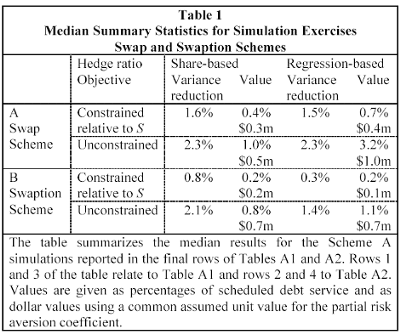
Our preference is to focus on median benefits, interpretable as the benefit to the average country, rather than on the (typically higher) sample average which is heavily influenced by the Burundian and Rwandan performance. Median benefits for the swap scheme (scheme A) are listed in Table 1.

We focus initially on the constrained swap-swaption schemes (rows 1 and 3 of Table 1). The schemes generally do give some reduction in the target variances, but generally equivalent to a debt reduction of 3% or less. A higher assumed risk aversion coefficient could raise these valuations to the 2½%-10% range. As anticipated, use of regression-based weights rather than export and import share weights generates a more marked variance reduction than does use of share-based weights.
The results show the swaps scheme (A) to be uniformly superior to the swaptions scheme (B) in terms of both variance reduction and the value of the associated welfare change. We acknowledge that these estimates depend on the choice of a particular bandwidth parameter ? , which we have taken as ±15%. Other choices may give different results. Finally, the unconstrained schemes (rows 2 and 4) give greater variance reduction and higher benefits than the schemes in which repayments are constrained relative to the original repayment schedule. We shall see below that this is at some cost to the creditors.
Overall, however, the most important conclusion that follows from the results summarized in Table 1 is the small extent of the reductions in variability and hence the low size of the overall benefits derivable from the scheme.

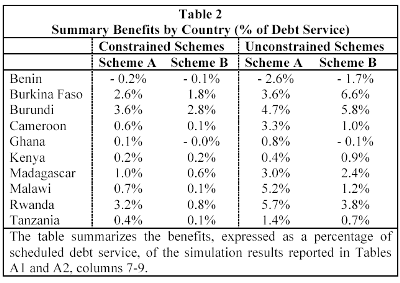
Table 2 summarizes the benefits of the best performing scheme for the ten countries in our sample using regression-based hedge parameters. Of the ten countries considered, Burkina Faso, Burundi and Rwanda are seen as obtaining greatest benefit from the proposed scheme20.
Malawi also obtains sizable benefits but only in the unconstrained scheme. Estimated benefits are negative or very low in Benin, Ghana and Kenya. In each country, the magnitude of the benefit (disbenefit in the case of Benin) is greater for the unconstrained schemes than for the constrained schemes.
20 Benefits are calculated over the ten year period 1991-2000. The simulation results for Rwanda exclude the civil war years 1994 and 1995. The results are much less favourable without this exclusion.
By Prof. Christopher L. Gilbert, Prof. Alexandra Tabova
Next: Simulated Impact on Creditor Institutions
Summary: Index