Once the quoting activity variable, related to each bank, is computed we pass to the next framework. It consists in modelling quote arrival in order to study its sensitivity to news announcements and to check whether banks quoting activity is affected by some quoting activity generated by other banks. In the first subsection we present the modelling framework and in the second one we display the results.
Modelling Quote Arrival
In the remainder of the paper we work with the number of quotes of individual banks on the Euro/Dollar exchange market. As the number of quotes for most banks is a relatively small number, usual time series models, based on the normal distribution, are not appropriate. Instead we work with time series models developed specifically for count data. In our sample, the data is not equi-dispersed, but it is under- and overdispersed. In order to model the dispersion in a more flexible way, we work with the double Poisson distribution of Efron (1986). The multivariate double autoregressive conditional Poisson (MDACP) model assumes that a bank’s number of quotes in period t, Ni;t, follows a double Poisson distribution, conditionally on past information:
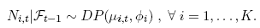 (4.1)
(4.1)
where Ft-1 is the information set generated by the past of the series up to and including time t - 1. The parameters µi,t and φi are respectively the mean and the coefficient of dispersion of the double Poisson. Its conditional variance is equal to
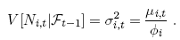 (4.2)
(4.2)
The distribution is over- or underdispersed for values of φi respectively less or greater than 1. When φi = 1 the distribution reduces to the equidispersed Poisson. The fact that the conditional mean is autocorrelated (see below, equation (4.4)) leads to some overdispersion, whose magnitude depends on the autoregressive coefficients. Whereas the autocorrelation (present as long as autoregressive coefficients are non-zero) leads to overdispersion, the effect of the double Poisson is to increase or lower this dispersion, leading to either over- or underdispersed models. In most cases, though, the conditional distribution adds to the overdispersion stemming from the autocorrelation to match the overdispersion in the data (see Appendix 1 for details about the double Poisson distribution).
The vector µt = (µi,t, ..., µK,t)' of conditional means is assumed to follow a VARMA(1; 1) process
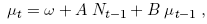 (4.3)
(4.3)
where A is a full rank matrix of coefficients capturing the impact of the lagged inter-dealers’ quoting activity effects, and B is a diagonal matrix of autoregressive coefficients of the own lagged conditional mean. More explicitly, the equation for each mean µi,t is
 (4.4)
(4.4)
we work with a (1; 1) structure for the mean equation, as this is parsimonious and flexible enough.
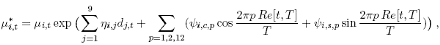
We are interested in analysing the impact of news announcements on individual banks’ quoting activity, allowing for diurnal seasonality. The news variables take the form of dummies for the presence of a certain announcement (dj,t , j = 1,..., 9.). The seasonality is modelled using the Fourier Flexible Form (FFF) introduced in the foreign exchange literature by Andersen and Bollerslev (1998) at daily, half daily and hourly frequencies. We modify the conditional mean in the following manner to include these exogenous regressors:
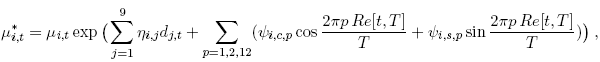
where Re[t, T] is the remainder of the integer division of t by T, the number of periods in a trading session. The way we include the regressors separates the autoregressive part from the effect of seasonality and news, and this functional form guarantees the positivity of the conditional mean.
In order to estimate our model, we consider a two-stage estimator as in Patton (2002), we use two step to estimate the copulas. In a first step, We assume that conditionally on the past, the different series of individual banks’ quoting activity are uncorrelated. This means that there is no contemporaneous correlation and that all the dependance between the series is assumed to be captured by the conditional mean. Consequently we estimate our equation system, equation by equation, using the maximum likelihood method with the Newey-West (HAC) standard errors and we get consistent estimators.
However, to generate
contemporaneous cross-correlation, we resort to copulas in a second step. We choose to work with the most intuitive one, which is arguably the Gaussian copula. It provides a very general
way of introducing dependance among several series with known marginals. Indeed, the first
step consists to hypothesize the independence between the series and estimate the system
equation without copulas, the second one consists to build the copulas using the results of
the previous step. Nevertheless, the second step procedure does not require any optimization,
as the maximum likelihood of the variance-covariance matrix of a multivariate normal with
zero mean, is simply the sample counterpart of the variance-covariance matrix of the inverse
of the standard univariate normal distribution function (Φ-1 ) of the probability integral
transformation 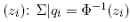 (see Appendix 2 for details about copulas).
In order to evaluate the quality of the model, we use tools developed in density forecast evaluation by Diebold, Gunther, and Tay (1998). The main idea is to use the cumulative distribution of the data under the estimated density and to check whether this is uniformly distributed, as it should be according to the probability integral transformation theorem (PITT) of Fisher (1932). The assumptions of the theorem are that the density is continuous, which is violated in the case of counts. We explain in the Appendix 3, how we deal with this problem using continuousation.
We also test the standardized residuals
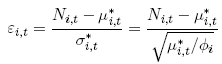
for autocorrelation, which would indicate a failure of the model to capture the dynamics of the series, and for deviation of their variance from one, which would indicate misspecification of the dispersion.
By Dr W. B. Omrane and A. Heinen
Next: Results
Summary: Index