When information is presented to us, we aren’t very good at seeing through how it is presented. We tend to take things at face value rather than drilling down to get to the detail. As an analogy consider the lines below, and which is longer?

Most people will go for the lower line. However, as the picture below makes clear, both lines are exactly the same length. We fail to see through the way in which the lines are presented. Yet when we make the frame transparent (i.e. we add the vertical lines) it becomes immediately clear that both lines are exactly the same length. This inability to see through the way in which things are presented is called narrow framing.

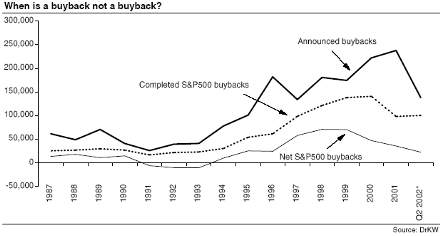
Let’s think about an example from finance. My own favourite is buybacks. Given that we have promoted the importance of dividends in contributing to total returns, a common retort is that surely we have missed the point that buybacks have replaced dividends as a cash distribution mechanism amongst investors. When most investors talk of buybacks they are referring to announced buybacks.
However, that is of no interest to us. After all there is nothing to prevent a company from announcing a buyback but not carrying it through. Hence the very least we should examine is completed buybacks. But even that is not enough. Too many buybacks are related to attempts to offset issuance (via option plans) and prevent dilution. These buybacks don’t matter to me as an investor. I should only really care about net buybacks. The chart below shows the enormous gulf that appears when one starts to look at net rather than announced buybacks.

This kind of narrow framing generates our seventh rule (7) Don’t take information at face value, think carefully about how it was presented to you. Let us turn our attention to Linda. Linda is 31, single, outspoken, and very bright. She majored in philosophy at university, and as a student was deeply concerned with issues surrounding equality and discrimination. Is it more likely that Linda works in a bank, or is it more likely that Linda works in a bank and is active in the feminist movement? Somewhat bizarrely many people go for the latter option.
But this can’t possibly be true. The second option is a subset of the first option, and a subset can never be larger than one of the contributing sets! So what is happening? Well, people judge events by how they appear, rather than by how likely they are. This is called representativeness. In the example of Linda, people picking the option that Linda works in a bank and is active in the feminist movement are underweighting the base rate that there are simply more people who work in banks, than people who work in banks and are active in the feminist movement!
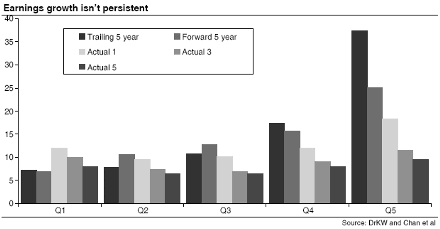
Representativeness has many applications in investment. For example, do investors think that good companies make good investments? If so this is a potential case of representativeness. A further example of representativeness is outlined in the chart below. It shows portfolios based around long term earnings growth forecasts for consensus analysts[2]. The first bar shows the per annum growth rate in the five years prior to expectation formation. It also traces out the earnings growth per annum in the 1,3 and 5 years following the forecasts.

The results show that analysts suffer representativness twice over. Firstly, companies that have seen high growth in the previous five years are forecast to continue to see very high earnings growth in the next five years.
2 It draws on work by Chan et al (2002) The level and persistence of growth rates, Journal of Finance forthcoming and our own work
By Dr James Montier
Next: Loss aversion amongst stock brokers
Summary: Index