The characteristics of model MACDR2 make it highly suitable for option trading because the holding period is on average only 5.06 days, thus, the time decay of the long option position is small. In model MACDR2, for the 1.5 % crossing-level, 70.76% of all trades generated an average profit of 5.94%. This profit can be increased significantly with the use of options and their leverage effect: ∆C/C / ∆S/S (C : Call price, S : Spot Stock price). The leverage is the higher the shorter the option maturity and the lower the volatility.
In this analysis, we use the same buy and sell criteria as in method MACDR2 for a 1.5% crossing-level. When a buy signal occurs, a call is bought, when a sell signal occurred, a put is bought. The calls and puts are at-the-money spot (the strike price = stock spot price), and priced using the historical volatility of each stock, together with a 4.5% interest rate and a 30-day option maturity. The time decay for each holding period is subtracted from the profit or loss of the trade.
To price the calls and puts we used the standard Black-Merton approach
C : Call price, European style
P : Put price, European style
S : Price of underlying stock
K : Strike price
T: Option maturity in years
N(d): Cumulative standard normal distribution at d
r: Risk-free annual interest rate, continuously compounded
q: Annual dividend yield, continuously compounded
σ: Annual volatility of the stock
At the time of the study (Fall 2000), eleven of the NASDAQ-100 stocks paid a dividend, so the Black-Merton approach, which includes dividends, is warranted. The average dividend yield of these 11 stocks was 0.62 pa. Since an at-the-money call and put with a 60% volatility and a 30-day option period has a leverage of 6.95 and 6.17 respectively, we expected the trading profit to increase by a factor of 6.17 to 6.95 minus the time decay of the option. In our study of the NASDAQ-100 stocks over the last 10 years, the average trading profit increases from 5.94% to 13.06% occurred.
Thus, when option trading is used on the basis of method MACDR2 with the 1.5% crossing-level, we derived the result that 70.76% of all trades generate an average per trade profit of 13.06%. Naturally, the use of leverage will increase any ex post positive mean strategy. Crucial is whether the risk-adjusted return increases with the help of options. To answer this question we calculated the Sharpe ratio for the holding stocks of the NASDAQ-100 and holding a call or put on the stocks of the NASDAQ-100:
S(N) = (rN – Rf) / Stdev (N)
S(ON) = (rON – Rf) / Stdev (ON)
where
S : Sharpe ratio
N: Stock of the NASDAQ-100
ON : Option (call or put) on N
rN: Average of return of N
rON: Average return of trading the option
Rf: Average annual risk free rate of return
Stdev: Standard Deviation of the annual percentage returns of N
Stdev: Standard Deviation of the annual percentage returns of ON
The yearly Sharpe ratio for the NASDAQ-100 stocks, S (N), using a risk free Treasury yield of 8.268% resulted in 12.36%. The yearly Sharpe ratio when trading options, S(ON), resulted in 55.65%. The later result was achieved by pricing the call and put with their individual historical 10-year volatility. This is slightly misleading, since the implied volatility has steadily increased in the past.
Figure 3 shows the development of the implied volatility for the VIX and VXN. The VIX is an index, traded on the CBOE, which reflects the implied volatility of 8 at-the money, 30-day options on stock of the S&P 500. The VXN reflects the implied volatility of an at-the-money, 30-day option on the NASDAQ-100. This contract was introduced on the CBOE on January 22, 2001.
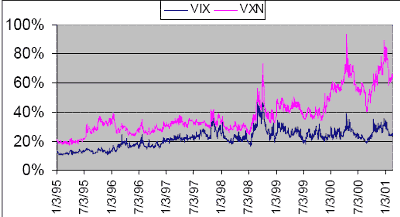
Figure 3: The implied volatility indices VIX and VXN from January 1st, 1995 to February 15, 2001
As to be expected, the Sharpe ratio for options is highly sensitive to the implied volatility used in the Black-Merton model. When using the average implied volatility of the VXN from January 1st to February 15, 2001, 68.16%, the Sharpe ratio S(ON) decreases from 55.65% to 39.50%. The Sharpe ratio of trading the individual stocks and trading option on these stocks is identical at 12.36% for an implied volatility of 85.35%, a level that was even exceeded in April and December 2000.
In this case, the Sharpe ratio of trading stocks exceeded the Sharpe ratio of trading options. The Sharpe ratio S(ON) is also highly sensitive with respect to the option maturity T. Increasing the option maturity from 30 to 45 days, decreases S(ON) to 36.78%; a decrease of the option maturity to 15 days increases S(ON) to 82.74%, when an implied volatility is used in the Black-Merton model, which is identical to the historical volatility.
Model MACDR2 and Volatility
An interesting question is whether the success rate of model MACDR2 is correlated to the volatility of a stock. We calculated the 30-day volatility for each stock and annualized with a factor of 260 trading days. The average annual volatility was then used for the graph below. Figure 4 shows the success rate of Model MACDR2 for a 0.5% crossing level and the volatility of the stock. Figure 4 shows a positive correlation with a p-level of 8.18E-09, t-statistics of 6.32 and an F-value of 40.02.
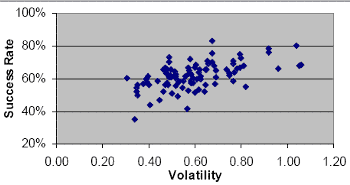
Figure 4: Success rate of model MACDR2, 0.5% crossing level, with respect to volatility; Target gain 3%
However, the correlation coefficient R is unsatisfactory low with 0.54. The overall slightly positive correlation makes sense from an intuitive point of view: High volatility stocks produce stronger and longer lasting trends, which can be better exploited by moving averages. The correlation analysis for crossing levels from 1% to 3.5% produce slightly worse results than the 0.5 crossing level.
Gunter Meissner, Albin Alex and Kai Nolte
Next: Model MACDR2 and Trading Volume
Summary: Index