Home >
Doc >
Trading System for Australian Dollar >
Single and Two Moving Averages – In and out-of-sample data
In this part of the experiment, certain tests were performed as follows: Single Moving Averages – period used are between 5 (five) to 100 (one hundred) weeks and filters used are 0.0, 0.5, 1.0 and 1.5 percent. Two Moving Averages – period used are between 5 (five) to 30 (thirty) weeks for short moving averages and between 15 (fifteen) and 100 (one hundred) weeks for long moving averages. Same filters used are 0.5, 1.0 and 1.5 percent for each possible combination.
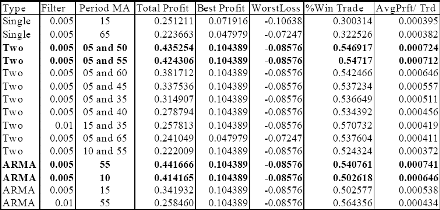
Moving Average with Auto-Regression – In this part of the test, an auto-regression forecast and moving average are computed. Moving average periods used are between 5 (five) to 30 (thirty) weeks and filters used are 0.5, 1.0 and 1.5 percent for each possible combination. The period used for building the model, as in-sample data is from 1st January 1986 to 29th July 1998 and period used for testing the model or out-of-sample data is from 5th August 1998 to 23rd June 1999. The results of the tests are presented in Table 2 (only those combinations generating relatively higher profits are displayed).
Table 2: Result Summaries for Different Moving Averages with and without filters for in-sample data. The data used is from 1st January 1986 to 29th July 1998 (in-sample data). The performance of the system is measured in terms of Total Profit, those lines in bold represent the highest profits. Moving Average with Auto regression (ARMA) seems to outperform two moving averages and single moving average.
As presented in the table above, the use of single moving average alone does not seem to generate substantial profits over time. The main reason is that the system generates too many unnecessary buying and selling signals to trade, which do not generate enough profits and due to the transaction costs, may result in lower prices or higher losses.
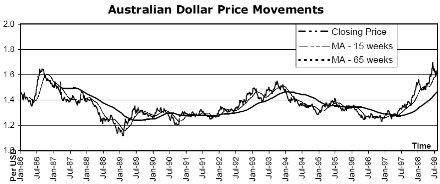
Generally the profitability results are closely linked to the number of trades the system generates. Large number of trades may cause overtrading which reduces the profit by substantial amount, mainly due to high transaction and funding costs. The results confirm the fact that the overall performance of the system improves with the use of filters around the moving averages. With the single moving average strategy, 15 (fifteen) and 65 (sixty-five) week perform best. To see the relationship among the closing price and moving averages (of 15 and 65 weeks), a line graph is presented in Chart 1.
Chart 1: Moving Averages 15 and 65 week and closing price of Australian Dollar from 1 January 1986 to 29 July 1998. MA 15 week seems to perform better when the trend is not very obvious while MA 65 will outperform if market is trending upward.
In general, while shorter period averages generate more false signals, it has the advantage of giving trend signals earlier in the move [Murphy, 1986]. It stands to reason that the more sensitive the average, the earlier the signals will be generated. The optimisation simulation is to find the optimum average that is sensitive enough to generate early signals, but insensitive enough to avoid most of the random noise.
The second method, which uses two moving averages, generally performs better results than the first one. When two moving averages are employed, the longer one is used for trend identification (for a longer term) and the shorter one for timing purposes or indicator. The purpose of this method is to use both shorter and longer period moving averages to better generate trading signals. The best moving averages used for the test are 5 (five) and 50 (fifty) weeks. In every case, the introduction of the filter rules seemed to improve the profitability of the system over time. For each trading rule, the number of buy signals is always greater than sell signals, which is consistent with the upward-trending market in the Australian Dollar over time period.
Among the tests performed, the use of ARMA (Auto Regression Moving Average) seemed to generate the highest profit. This is consistent with random walk theory that the best predictor of today’s price is yesterday’s. The test finds that ’Total Profit’ of the trades simulated from 1st January 1986 to 29th July 1998 exceeded that from 1st January 1986 to 23rd June 1999 (next test). In other words, the model developed using data from 1st January 1986 to 29th July 1998 should not be used to trade for the period of 6th August 1999 to 23rd July 1999. The main reason for this is the fact that the trend differed during the period of 5th August 1998 to 23rd June 1999 compared to the previous 12 (twelve) years (Chart 1).
According to O’Loughlin [1999], one of the reasons for Australian Dollar’s depreciation is due to the fact that 15.5% of the Australian Gross National Product is vulnerable to export shocks with Asian countries. For out-of-sample data, which starts from 5th August 1998 to 23rd June 1999, another optimisation was performed with the best moving average and filter are as follows:

Table 3: Result Summary for Different Moving Averages with and without Filters. The data used is from 5th August 1998 to 23rd June 1999 and another optimisation was employed to obtain best profitability.
The optimised combination for out-of-sample data and in-sample data are different. Using the out-of-sample data, the best long moving average is 25 (twenty-five) instead of 50 (fifty) or 55 (fifty-five) week which is the case for in-sample data. The main factors that influence the result are the fact that the out-of-sample data only has 46 (forty-six) data points and also the fact that Australian Dollar has continued to depreciate in the past two years.
Prof. Clarence N W Tan and Herlina Dihardjo
Next: Single and Two Moving Averages - Full Series
Summary: Index