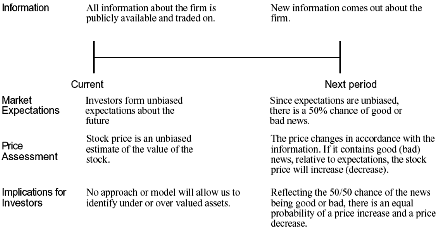
1. Investors are not always rational in the way they set expectations. These irrationalities may lead to expectations being set too low for some assets at some times and too high for other assets at other times. Thus, the next piece of information is more likely to contain good news for the first asset and bad news for the second.
2. Price changes themselves may provide information to markets. Thus, the fact that a stock has gone up strongly the last four days may be viewed as good news by investors, making it more likely that the price will go up today then down.
The Empirical Evidence on Price Patterns
Investors have used price charts and price patterns as tools for predicting future price movements for as long as there have been financial markets.
The first studies of market efficiency focused on the relationship between price changes over time, to see if in fact such predictions were feasible.
Evidence can be classified into two classes:
studies that focus on short-term (intraday, daily and weekly price movements) price behavior and
research that examines long-term (annual and five-year returns) price movements.
Serial correlation
Serial correlation measures the correlation between price changes in consecutive time periods
Measure of how much price change in any period depends upon price change over prior time period. 0: imply that price changes in consecutive time periods are uncorrelated with each other
>0: evidence of price momentum in markets
<0: Evidence of price reversals
Serial Correlation and Excess Returns
From viewpoint of investment strategy, serial correlations can be exploited to earn excess returns.
• A positive serial correlation would be exploited by a strategy of buying after periods with positive returns and selling after periods with negative returns.
• A negative serial correlation would suggest a strategy of buying after periods with negative returns and selling after periods with positive returns.
• The correlations must be large enough for investors to generate profits to cover transactions costs.
Prof. Aswath Damodaran
Next: Serial Correlation in Short-period Returns
Summary: Index