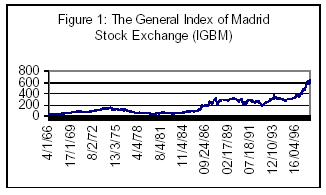
The database used is composed of 6931 observations (from 4 January 1966 to 15 October 1997) of daily closing prices of the General Index of the Madrid Stock Exchange (IGBM) (see Figure 1). This index is sufficiently representative of the Spanish Stock Market, since it accounts for more than 90 percent of total trading volume.

Drawing from previous academic studies and the technical analysis literature, in this paper we employ two of the simplest and most common trading rules: moving averages and support and resistance. BLL (1992) stress the substantial danger of detecting spurious patterns in security returns if trading strategies are both discovered and tested in the same database. To mitigate the danger of "data snooping" biased, we do not search for ex-post "successful" technical trading rules, but rather evaluate a wide set of rules that have been known to practitioners for at least several decades.
Also, like BLL (1992), we report the results of all trading rules we evaluate. According to the moving average rule, buy and sell signals are generated by two moving averages of the level of the index: a long-period average and a shortperiod average. A typical moving average trading rule prescribes a buy (sell) when the short-period moving average crosses the long-period moving average from below (above) (i. e. when the original time series is rising (falling) relatively fast). As can be seen, the moving average rule is essentially a trend following system because when prices are rising (falling), the short-period average tends to have larger (lower) values than the long-period average, signalling a long (short) position.
We evaluate the following popular moving average rules: 1-50, 1-150, 5- 150, 1-200 and 2-200, where the first number in each pair indicates the days in the short period and the second number shows the days in the long period. These rules are often modified by introducing a band around the moving average, which reduces the number of buy (sell) signals by eliminating "whiplash" signals when the short and long period moving averages are close to each other. We are going to evaluate two moving average trading rules.
The first moving average rule we examine, called the variable length moving average (VMA), implies a buy (sell) signal is generated when the short period moving average is above (below) the long period moving average by more than one percent. If the short period moving average is inside the band, no signal is generated. This method attempts to simulate a strategy where traders go long as the short moving average moves above the long and short when it is below. With a band of zero, this method classifies all days into either buys or sells.
The second moving average trading rule that we analyse is called a fixedlength moving average (FMA). Since it is stressed that returns should be different for a few days following a crossover, in this strategy a buy (sell) signal is generated when the short moving average cuts the long moving average from below (above). Following BLL (1992), we compute returns during the next ten days. Other signals occurring during this ten-day period are ignored. Finally, we consider the trading range break-out (TRB) rule.
With this technical rule, a buy signal is generated when the price penetrates a resistance level, defined as a local maximum. On the other hand, a sell signal is generated when the price penetrates a support level, defined as a local minimum. As with the moving average rule, maximum (minimum) prices were determined on the past 50, 150 and 200 days, and the TRB rules are implemented with and without a one percent band.
By F. Fernández, S. Sosvilla and J. Andrada
Next: Preliminary empirical results
Summary: Index