The estimates are derived from the daily US-dollar spot exchange rates against the German mark (DM), the British pound (BP), the Japanese yen (YEN), and the Swiss franc (SFRS) series and the according interbank overnight interest rates. The fundamental value of the exchange rate is described by ppp using monthly price indexes obtained from the IMF International Financial Statistics.
We transform ppp data to the daily frequency, taking the observed value for the entire month, which seems to be compatible with the information environment of agents in a daily trading context7. Moving averages of the exchange rate (mashort and malong) are constructed in t using unweighted data up to t–1. We use RATS 5.0 programming for the quasi maximum likelihood estimation method.
Since the assumption of conditional normality cannot be maintained, robust estimates of the covariance matrices of the parameter estimates are calculated using the BFGS algorithm. Under fairly weak conditions, the resulting estimates are even consistent when the conditional distribution of the residuals is non-normal (Bollerslev and Wooldridge, 1992). The sample extends from January 1980 to December 1996. The series of the spot rate and the PPP relation are presented in Figure 1.
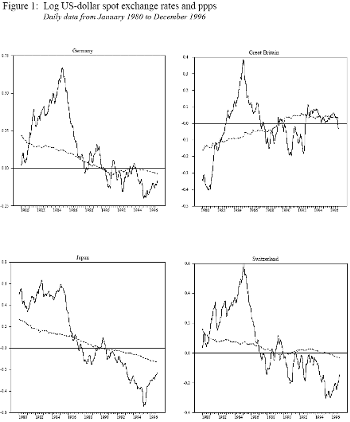
Table 1 contains the estimation results of the different Markov regime-switching models. As regards the transition probabilities, P and Q range above 0.94 (except for the yen) thereby indicating high persistence of regimes. The unconditional probability of the fundamentalist regime

is in every case lower than that assigned to the chartist regime. This is also reflected in the expected duration of regimes. The fundamentalist regimes are expected to last up to 26 trading days whereas the (second) chartist regimes have a longer duration of up to 46 trading days. Significant estimates of the standard deviation point to regime-dependent heteroskedasticity capturing periods of high and low volatility: The second moment in the first regimes is twice as high as the standard deviation in the second regimes. The estimates of chartist and fundamentalist forecast coefficients are of the correct sign in all cases. Except for the BP, the θs are statistically significant at least at the ten percent level whereas the ψs are statistically significant at the one percent level.
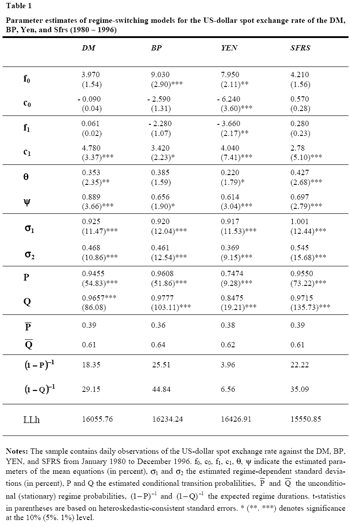
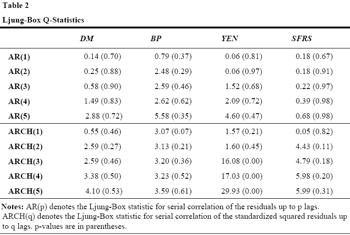
Table 2 reports Ljung-Box Q-statistics relating to the residuals as well as to the squared standardized residuals of the estimated models, thereby testing for serial correlation and autoregressive conditional heteroskedasticity. Since we are using daily data, residuals are tested for 5th-order autocorrelation and ARCH effects. The P-values reject serial correlation in the residuals for all exchange rates and the presence of ARCH non-linearity for the DM, BP, and the SFRS. Ljung-Box-Q statistics for the yen suggest that there are remaining higherorder ARCH effects in the residuals. The figures in general show that the model is able to capture mean dynamics as well as conditional heteroskedasticity of high frequency exchange rate data by regime-switching8.
The results provide support for the view that the exchange rates under consideration were sequentially predictable by chartist and fundamentalist techniques. Although the evidence on moving average trading was found to be stable across different exchange rates, there remains some probability that the results were driven by arbitrarily chosen spans of the short- and long-run average. Thus, we provide parameter estimates for different spans of both averages. With a view to greater clarity, Table 3 provides only the estimation results of chartist and fundamentalist forecasts for the 10, 14, and 38-day short-run moving average and the 100, 150, and 200-day long-run moving average.
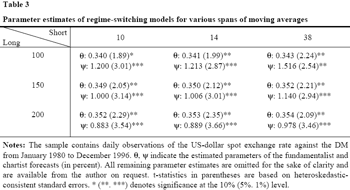
Inspection of Table 3 leads to the conclusion that the results are robust over a wide range of moving average trading rules. The parameter estimates differ slightly at best. This is compatible with the view that moving average trading rules do not produce adverse signals, whatever span might be used for short- and long-run averages. Finally, to deliver some graphical examination of the model’s switching behaviour, the smoothed chartist regime probabilities of the US-dollar/DM model are plotted together with the spot exchange rate in Figure 2.
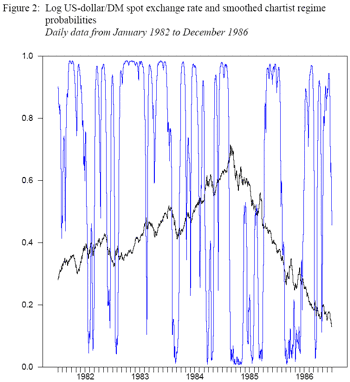
As can be seen from the figure, the regime probabilities9 indicate a strong chartist forecasting performance during the appreciation of the US-dollar from 1982 to mid 1985, only interrupted by a few high-volatility periods. Moreover, the regime probabilities show that during the following downturn, chartist forecasting was the superior prediction strategy in low volatility periods. The assignment of technical analysis to low volatility regimes was explained in section 2 by the fact that the quality of the oscillator model's signals is a decreasing function of exchange rate volatility.
7 To check whether or not the estimation results are driven by this simplifying assumption we experimented with interpolated data. According to standard unit root tests, the ppp values have also been interpolated as an I(1) process. However, the estimation results do not change significantly.
8 The regime classification might be driven by state-dependent heteroskedasticity, which is often explained by the dominance of second moments in characterizing the distribution of high-frequency data (Dewachter, 1997). Therefore, we first tested a four-state regime-switching model, allowing for independent switches in means and variances, but the EM algorithm did not converge. Second, both the chartist and the fundamentalist parameters were included in each regime to control for the correct assignment of mean specifications to high and low variance regimes. The fundamentalist forecast in the low volatility regime as well as the chartist forecast in the high volatility regime were insignificant at common levels, leading us to the specifications delivered in the text. The results are available on request.
9 Since p1,t = 1 – p0,t the probability of fundamentalist dominance on the foreign exchange market is high whenever the chartist regime probability is low.
Prof. Stefan Reitz
Next: Concluding remarks
Summary: Index