While investors and analysts may increasingly bemoan the increasing complexity of financial statements, there is no simple or easy measure of complexity. There are some who would argue that they know complexity when they see it, but this is not a very satisfying or objective measure of complexity. In this section, we consider some ways in which we can measure the complexity of a firm’s financial statements:
Volume of data in financial statement
A simplistic (but surprisingly effective) measure of complexity is the sheer volume of data in a financial statement. For instance, the 10K filings made by firms with the SEC range in size from less than 100 pages to in excess of 400 pages. In table 1, we summarize the length of the filings for the 2000 financial year for the 10 largest market capitalization firms in the United States.
Table 1: Complexity in Financial Statements: U.S. companies


Using this measure, Citigroup and AIG have the most complex financial statements, whereas Microsoft, Intel and Johnson & Johnson have the least complex statements. The reason is that it is a simplistic measure, of course, is because a short 10K can reflect a simple business and financial structure or just indicate an absence of information about the firm’s operations.
The Opacity Index
Opacity Index In the late 1990s, Price Waterhouse developed an “opacity index” to measure the transparency (or absence thereof) of financial statements in different countries. Defining opacity as the “the lack of clear, accurate, formal, easily discernible, and widely accepted practices”, Price Waterhouse looked at five factors.
Oi = 1/5 * [Ci + Li + Ei + Ai + Ri],
where i indexes the countries and:
O refers to the composite O-Factor (the final score);
C refers to the impact of corrupt practices;
L refers to the effect of legal and judicial opacity (including shareholder rights);
E refers to economic/policy opacity;
A refers to accounting/corporate governance opacity; and
R refers to the impact of regulatory opacity and uncertainty/arbitrariness.
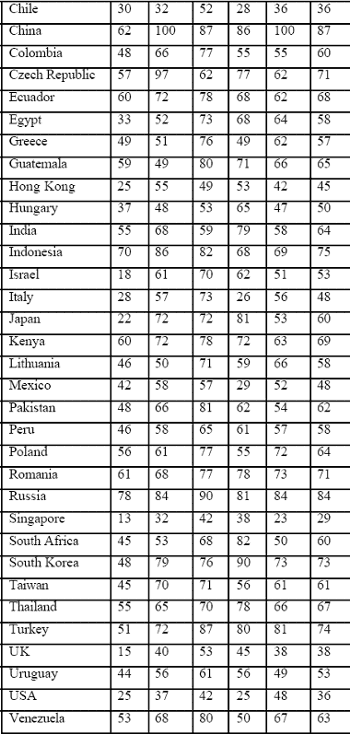
They based the country scores for each factor on a survey of CFOs, equity analysts, bankers and Price Waterhouse employees in 35 countries in the third and fourth quarters of 2000. The survey responses were converted into a numerical score and weighted to arrive at each country’s opacity measure. Table 2 summarizes the results for the 35 countries.
Table 2: Price Waterhouse Opacity Index


Based on this measure, Singapore has the least opacity whereas China and Russia have the most opacity in their financial statements. Note that this measure is a composite measure that includes, in addition to accounting transparency, other factors such as corruption and legal practices. The survey questions that directly relate to accounting opacity do provide an interesting perspective on what the survey participants view as the key accounting issues and problems in each country. Among the most common problems noted were:
a. Failure to disclose related party transactions, where there are potential conflicts of interests between officers of the company and its stockholders. (Numerous emerging markets)
b. Reliability of exhibits: Exhibits backing up the financial statements either are missing or do not include important information. (China, Russia)
c. Inflation accounting: In many cases, attempts to do inflation accounting resulted in more complicated financial statements and not more informative ones. (Chile, Colombia)
d. Inconsistent rules on consolidation and treatment of goodwill (U.S., U.K., Singapore and South Africa)
e. Dual bookkeeping: Firms maintain different financial statements for different authorities, leading to confusion about a firm’s true financial standing.
An Information Based Index
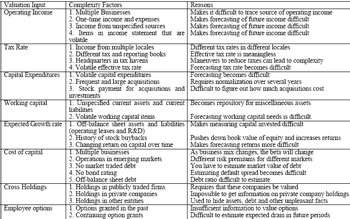
One way to think about complexity is to begin with the inputs that go into the value of a company and consider all those factors that may make deriving those inputs more difficult in a measure of complexity. For instance, one of the inputs you need to value a firm is risk.
It is more difficult to estimate risk parameters for firms that are in multiple businesses than it is for firms that are in a single business for two reasons – different businesses can have different risk profiles and changes in the mix can change the overall firm’s risk profile. Breaking down the valuation inputs into their main components, we can identify the factors that determine complexity: Table 3 represents an attempt (undoubtedly incomplete) to list out these factors. The contributions made by each of the factors to complexity vary, with some factors (such as volatile effective tax rates) being less important than others (substantial cross holdings in private companies).
How much we weight each factor will depend upon how much of the value is attributable to it, and whether it makes estimation more difficult or impossible. To illustrate, operating leases and R&D expenses undoubtedly skew financial statements, resulting in misstated earnings and meaningless book values, but there is enough information usually available in financial statements for analysts to correct the problems. In contrast, earnings that are not clearly identified as non-operating or onetime earnings cannot be easily be incorporated into value. Once we have identified the factors that determine complexity, and categorize them based upon their importance, you can construct complexity scores for firms. These complexity scores should allow us to distinguish between more complex and less complex firms, and to adjust value for complexity (if necessary). Appendix 1 contains one such attempt to come up with a complexity score.
Table 3: Complexity Factors and Valuation Inputs
Prof. Aswath Damodaran
Next: Consequences of Complexity
Summary: Index
