CHANGE LANGUAGE | Home > Doc > Learn Relative Strength Point & Figure Charting > Triple top buy signal – example #1 – There are many examples of triple top buy signals on the chart

Market Dynamics Learn Relative Strength Point & Figure Charting

The Spirit of Technical Analysis

Chart construction and layout

Region of Excess Return

Region of serious under-performance

Extreme volatility - Shortest time period

Analysis of trends

Triple top buy signal

Triple bottom sell signal

45 degree lines- Bullish

High performance bullish support lines Example 1-2

High performance bullish support lines Example 3-4

High performance bullish support lines Example 5-6

High performance bullish support lines Example 7-8

High performance bullish support lines Example 9-10

Support and resistance

Resistance below the bearish resistance line

Trading ranges

Channels

Major long-term trends Example 1-2

Major long-term trends Example 3-4

Major long-term trends Example 5

Major long-term uptrends Example 1-2

Major long-term uptrends Example 3-4

Major long-term uptrends Example 5

Major long-term down-trends

Natural trendlines

Major reversal patterns

Major bases

Breakouts Example 1-2

Breakouts Example 3-4

Breakouts Example 5-6

Breakouts Example 7

Some thoughts about how the market works

Theory of Runs

Some thoughts about portfolio management

Relative strength study - real time - uptrends and downtrend lists published by WCA in 1999

Learn Relative Strength Point & Figure Charting

Triple top buy signal

example 1

There are many examples of triple top buy signals on the chart.

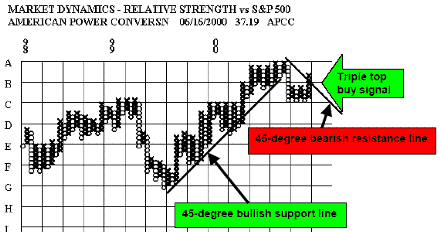
This triple top buy signal has been registered after a small decline but there is overhead resistance nearby. The bearish resistance line has been exceeded which is a good sign. If the top row of Xs at row A can be exceeded then the resistance has been taken out and a good move might follow.

example 2

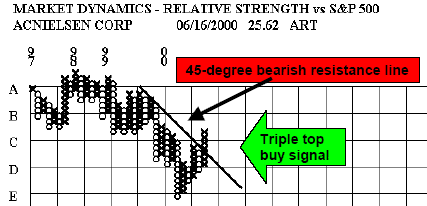
This example shows a triple top buy signal that has been registered shortly after the bearish resistance line was crossed. There is resistance overhead in this example but the signal looks good nonetheless.

example 3

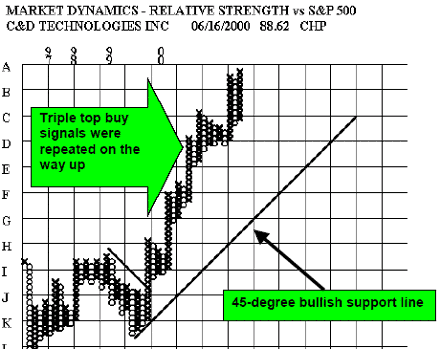
After the low at (K, 4) a triple top buy signal was given along with the breakout above a short bearish resistance line. After this reversal the stock became very bullish and proceeded to register additional triple top buy signals as it rose. In using Japanese Kagi charts which are similar to point & figure, there is a rule that suggests that before a trend ends - there will be nine columns up that will make new highs above the recent highs. This stock has recorded 7 so far. I have observed this phenomenon quite a few times and after the stock has recorded 8 or more new highs it is probably best to anticipate a reversal of the uptrend.

By W. Clay Allen CFA

PerformanceTrading.it ed il suo contenuto sono di esclusiva proprietà degli autori. E' vietata la riproduzione anche parziale di qualsiasi parte del sito senza autorizzazione, compresa la grafica e il layout. Prima della consultazione del sito leggere il disclaimer nella sezione [info].