Portfolio management must be adaptive

In order to adapt to changing conditions we need a simple, visual road map that steers us toward the positive changes and away from the negative developments. It is the markets function to supply this information in order to provide signals to the holders of capital. How else could the capital markets fulfill their function?
While the stock market may have many negative connotations it is not a casino and it has a very important role to fulfill. I believe that communism collapsed in Russia because the central planners did not know how to allocate the nation’s capital – only a free market can do that.
Portfolio Simulation

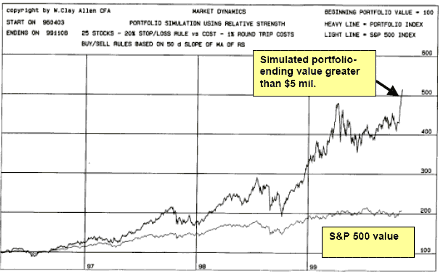
The graph above shows the results of a recent portfolio simulation that covered about 3.5 years – ending in the fall of ’99. The rules were simple; 25 stocks, fully invested at all times, 1% round-trip commission costs, 20% stop-loss against cost, if the slope of the 50 day moving average of relative strength across a span of 21 days turned negative the stock was sold the next day as of the closing price, and the strongest relative strength stock on the basis of the 21 day slope of a 50 day moving average of relative strength was purchased to replace the stock that was sold.
Daily closing price data was used and relative strength was based on the S&P 500 index. The turnover was very high but commissions were charged at a reasonable rate. This portfolio simulation was drawn from a collection of 400 institutional stocks that also had high volatility as measured by their standard deviation of daily percent price changes. This database has been maintained by WCA for over ten years.
All stocks in this database shared one requirement – they had to have 4 years of trading history to be included. W. Clay Allen CFA performed all programming and the data was checked for accuracy. The simulated portfolio value started at $1 mil and rose to slightly more than $5 mil - almost 2.5 times the performance of the S&P 500 over this three year period. There is no guarantee that the future will be like the past but this simulation seems to confirm the effectiveness of using relative strength trend following as a portfolio management tool.
By W. Clay Allen CFA
Next: Relative strength study - real time - uptrends and downtrend lists published by WCA in 1999
Summary: Index