Fig. 34
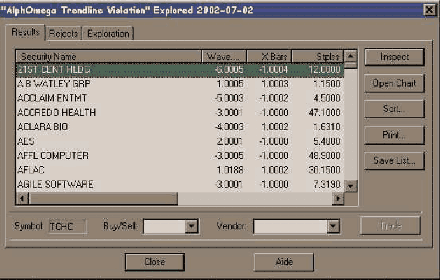
This screen shows The Explorer™ window and the output of AlphOmega Trendline Violation. When we run an exploration, a filter is applied to take out securities not meeting selected criteria. For example, in certain explorations, all securities where the wave pattern is counter trend of the corner indicator are discarded. It also discards all securities that are less than one dollar in price and less than 100,000 shares in 50 days MA of volume. The filter can be modified with the password protecting the code from unwanted changes. In addition, the exploration will not flag up waves for a down trending security and down waves for an up trending security, in other words, the corrective waves unless it is designed for that.
This is an additional precaution as waves moving against a long set trend are very short, risky and common sense dictates that we should not trade against the trend. Be careful, not all the explorations have such filters! There are explorations for all sensitivities such as AO Elliott Waves Explorations. With those Explorations most filters have been removed so we will get a list of all the securities we are scanning with all the wave data related to them whether an impulse wave or a corrective wave. Although they are provided, we don’t need to run them on a daily basis because without a filter we will have to analyse a lot of data and securities before finding the valuable candidates. Some explorations such as AO Elliott Waves Normal (I) have filters and will display only impulsive waves. Check the text in the exploration box to see the exact purpose of an exploration and details on the report columns. Under the columns Bull and Bear, we see the wave number and where a 6 refers to a C wave. For waves A or B, the labels 1 and 2 respectively are used. For analytical purposes, a wave one is usually difficult to trade, as we have neither guideline for its end nor any price projection other than a speculative reference to the previous pattern. Some will run long and powerful others will run short. Elliott Wave analysts usually trade waves 3, 5 and C; waves 2, 4 and B are used to time entries or exits. Note that a different wave count could appear under both Bull and Bear column. The highest count is the prime while the lowest is the alternate (Fallback position) when the wave fails. The alternate count disappears when the threshold confirming the prime count wave is crossed.
Test: Alternate count cannot be more than a wave 2; can you figure out why? Remember that the alternate count is valuable information. Some explorations are very slow to run as they indirectly call on indicators that are not part of the exploration. In the note box of the exploration, there is an indication of the execution speed. All the ones starting with “AO” are usually faster. Explorations like RSI Trend Violation and Trendline Violation will give you a list of the securities where the RSI or the price has penetrated the trend line. These signals will last for only a few days to avoid listing securities that are too far along the new trend.
TIP: A useful tip is to sort the results by bars so we look first at the most recent additions to the list. It enables us to focus on the fresh opportunities. If we open our charts from The Explorer™ window, the default template will normally appear instead of the specific template that would fit the exploration. There is a way to overcome this by simply calling the templates we installed earlier. This action will open a chart in addition to the smart chart. I would also recommend applying to this chart, the corresponding AO ZZ indicator to ascertain that it is still moving in the proper direction. It is a lot easier to see how the waves are counted when we have the indicator in front of us. Use the AO ZZ to see Zig Zag from high to low!
Special Exploration
Have you ever entered a trade, based on the signal that your favorite exploration gave, to find out that the last bar on your chart is not yesterday but the day before yesterday? That yesterday was a tremendous rally and today is the correction? Even the best quote providers have their lapses and no matter how keen you are at updating your database, errors will find their way in. The only way to catch such an error is to look for it by comparing the last date in to the date that should be in; as MetaStock® does not have a current system date function, you must provide it.
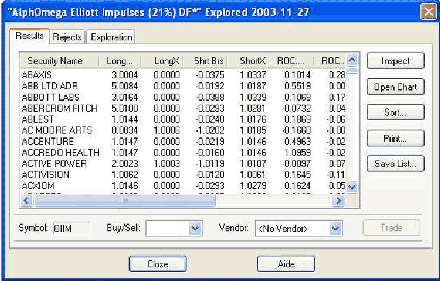
AlphOmega uses an indicator variable to screen securities that were not updated in the last download. The use of this variable is coded to one exploration but could be added to any. The requirement to use this variable is a daily update of AO GDate so that when the explorer is scanning, it finds the correct last date to be validated. The importance of accurate data is key to the trader and since you will spend time scanning your database, the selected candidates should have the most current information. You do not want to enter a trade one or more days after the rest of the market. Here is a screenshot of it.

Fig. 34a
AlphOmega Elliott Impulses (21%) DF* will scan the database for bullish or bearish impulses just like some of the other explorations, except that it will select only securities updated to the date value you entered. The asterisk is to remind you to update the global variable in AO GDate before you run the exploration.
Next: Signal Explorations
Summary: Index