In theory, what is the nature of beta in a world where returns reflect both compensation for risk and mispricing stemming from noise trader errors? That is one of the questions posed by Shefrin-Statman (1994). In this section, I extend their analysis to address the formal connection between the mean-variance efficient frontier and the pricing kernel, and the effect of nonzero sentiment upon the frontier.
The risk premium on any security Z is determined by the covariance of its return with the kernel. In fact the risk premium is just

Of course, the risk premium can also be expressed in CAPM-like terms, by means of a mean-variance efficient benchmark portfolio and a beta. Beta is just the covariance between r(Z) and the return to the benchmark, divided by the variance of the benchmark return.
Below I provide a general characterization of the mean-variance efficient frontier in terms of the pricing kernel.36 Identifying the benchmark involves maximizing the expected quadratic utility

of the return r to a one dollar investment. This maximization underlies the next theorem.
Theorem 7 The return rMV (x1) to a mean-variance efficient portfolio is:
 (26)
(26)
where

and ν is a nonnegative parameter whose variation generates the mean-variance efficient frontier. Theorem 7 expresses the mean-variance return in terms of the pricing kernel. Notice that the return rMV is linear in the kernel M(x1), and has a negative coefficient.[37] Hence, the return is low in a state that bears a high price per unit probability.
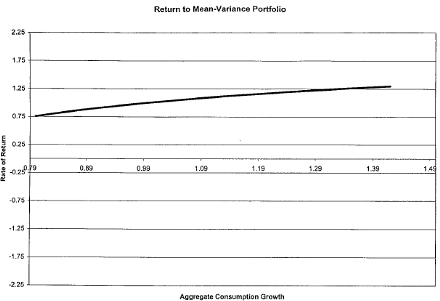
Sentiment can alter the shape of the relationship between the mean-variance return rMV and aggregate consumption growth g.[38] In an efficient market, Λ Ξ 0, in which case rMV is a monotone increasing, concave function of g, for a suitably low value of ν.[39] This follows from (7) and the proof of theorem 7 (see the appendix). In an efficient market, a mean-variance portfolio earns very low returns in low-consumption growth rate states.

Figure 8a

Figure 8b
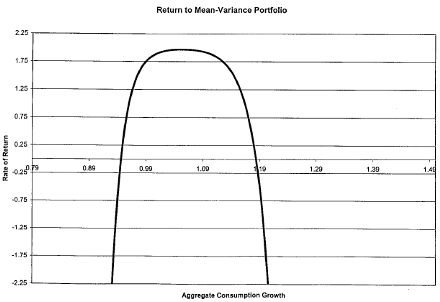
Indeed mean-variance returns can fall below one hundred percent: there is no limited liability attached to a mean-variance efficient portfolio.[40] However, sentiment can distort the shape of the above relationship between rMV and aggregate consumption growth g, by introducing local extrema.[41] To see how a smile pattern in the sentiment function can affect the shape of the rMV function, consider figure 8, which involves the same example that I introduced in section 4. The top panel displays the graph of the return to a mean-variance efficient portfolio as a function of g, when sentiment is zero. Here the function is concave and monotone increasing. The bottom panel displays the graph of the same relationship for the case when the sentiment function exhibits the smile pattern displayed in figure 8b. Here the rMV -function achieves a local maximum at g = 1.05. That is, the graph exhibits a “frown” pattern. To understand what drives the shape of the rMV -function in this example, recall that by theorem 7, rMV is a linear function of M with a negative coefficient. Moreover, the log-kernel displays a smile pattern. The combination of these two features leads the graph of rMV to feature a frown. Looking at the issue more closely, observe that in figure 1, the mode of Π lies in the valley between the local maxima of PR. This implies underpricing in the valley (where Π > PR), and overpricing at the extremes (where Π < PR). That is, the bulls cause the the highest consumption growth rate states to be overpriced, and the bears cause the lowest consumption growth rate states to be overpriced. A mean-variance efficient portfolio, constructed using objectively correct probabilities, will respond to the attendant mispricing by tilting towards underpriced states, and away from overpriced states; hence, the “frown”. What does a “frown” pattern, meaning the existence of a local maximum in the mean-variance efficient graph, imply for the pricing of securities, like the market portfolio, that feature high payoffs in the highest consumption growth states? It implies that these securities have negative “up-betas,” and low overall betas.[42]
Prof. Hersh Shefrin
Next: The Market Portfolio
Summary: Index