One of the most popular methods of Technical Analysis is the MACD, Moving Average Convergence Divergence, indicator. The MACD uses three exponentially smoothed averages to identify a trend reversal or a continuation of a trend. The indicator, which was developed by Gerald Appel in 1979, reduces to two averages. The first, called the MACD1 indicator, is the difference between two exponential averages, usually a 26-day and a 12-day average.
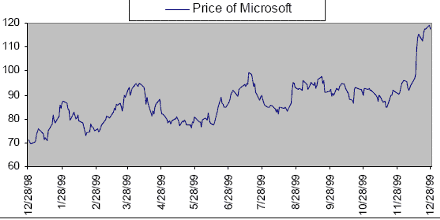
The second, called Signal indicator, is the 9-day moving average of the MACD1 indicator. The terms “convergence” and “divergence” refer to a narrowing and widening of the difference of the MACD1 and the Signal indicator: A buy signal is given, when the more volatile average, the MACD1 indicator, crosses the less volatile average, the Signal indicator, from beneath. If the MACD1 line crosses the Signal line from above, a sell signal is given. The bigger the angle of the crossing, the more significant the buy or sell signal is. Let's look at an example. From December 28th 1998 to December 28th 1999, the price of Microsoft moved as in figure 1:

Figure 1: The price movement of Microsoft
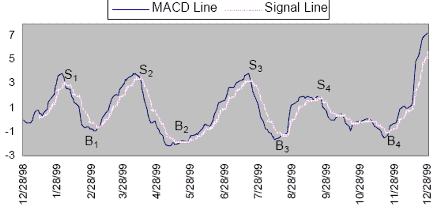
From the stock price movement in Figure 1 we get the following moving average

Figure 2: MACD1 and Signal indicator resulting from Figure 1
From Figure 1 and 2, we can derive that the buy signals B1, B2, B3 and B4 all worked well: The price in Figure 1 increases after the signals. All sell signals S1, S2, S3 and S4 also worked well. The price in Figure 1 decreases after each sell signal.
From Figure 1 and 2, we can also recognize the lagging feature of the MACD indicator. All buy and sell signals occurs shortly after the bottom or top of the price movement. The reason why the traditional MACD indicator works so well in Figures 1 and 2 is the fact that Microsoft moved in ideal trends, especially from December 28, 1998 to August 28, 1999. During this period, we can recognize clear upward and downward trends with a period of 30 to 50 days. In this environment the traditional MACD indicator works well.
From August 28, 1999 to November 18, 1999, we had a sideways market. Therefore, no clear buy or sell signal, meaning no high degree crossing of the MACD and Signal indicator, was given during that period.
However, stock prices do not always exhibit the MACD favorable trends as in Figure 1. Often a trend, although believed strong, falters. Also, since the MACD is a lagging indicator, often the reversal of the trade is done too late. These two drawbacks are addressed in this article and methodologies are derived to overcome the shortcomings.
The exponential moving average (EMA) used in the MACD method is calculated as

where
EMAt : current value of exponential moving average
Pt = current price of underlying asset
K = 2 / (number of periods + 1)
Equation (1) implicitly includes the exponential smoothing: If K = 0.2, (number of periods is 9) and EMAt-1 = 10, it follows that a current price of Pt = 12 leads to an EMAt = 10.4, a price Pt = 8 leads to EMAt = 9.6; a price Pt = 4 leads to an EMAt = 8.8.
Gunter Meissner, Albin Alex and Kai Nolte
Next: Analysis
Summary: Index