A number of indicators are built on looking at moving averages of stock prices over time. A moving average line smooths out fluctuations and enables the chartist to see trends in the stock price. How that trend is interpreted then depends upon the chartist.
Volume Indicators
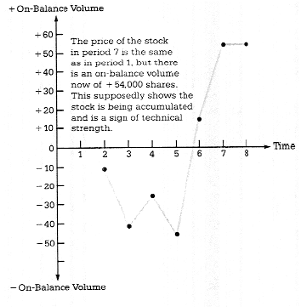
Some technical analysts believe that there is information about future price changes in trading volume shifts.

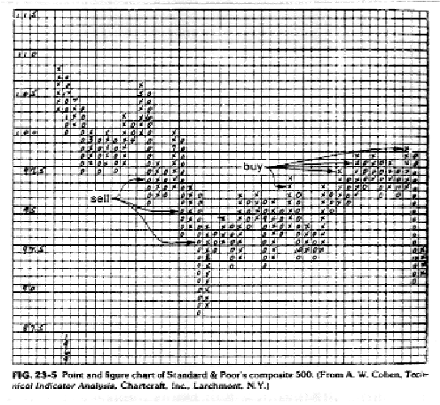
Point and Figure Charts

Market learn slowly: The Momentum Investors
Basis: The argument here is that markets learn slowly. Thus, investors who are a little quicker than the market in assimilating and understanding information will earn excess returns. In addition, if markets learn slowly, there will be price drifts (i.e., prices will move up or down over extended periods) and technical analysis can detect these drifts and take advantage of them.
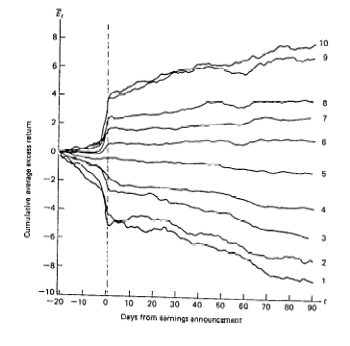
The Evidence: There is evidence, albeit mild, that prices do drift after significant news announcements. For instance, following up on price changes after large earnings surprises provides the following evidence.
Price Drifts after Earnings Announcements
Note the price drift, especially after the most extreme earnings announcements.

Prof. Aswath Damodaran
Next: Insider Buying and Selling
Summary: Index