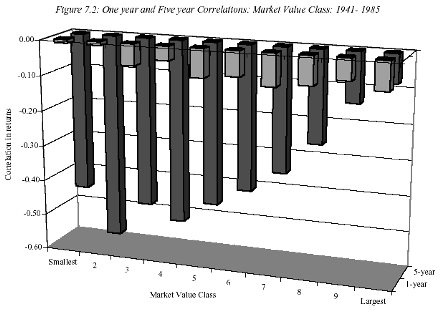
In contrast to the studies of short term correlation, there is evidence of strong correlation in long term returns.
When long term is defined as months, there is positive correlation - a momentum effect.
When long term is defined as years, there is negative correlation - reversal in prices. The effect is much stronger for smaller companies.
Evidence of long term correlation

Seasonal and Temporal Effects on Prices
Empirical studies indicate a variety of seasonal and temporal irregularities in stock prices. Among them are:
• The January Effect: Stocks, on average, tend to do much better in January than in any other month of the year.
• The Weekend Effect: Stocks, on average, seem to do much worse on Mondays than on any other day of the week.
• The Mid-day Swoon: Stocks, on average, tend to do much worse in the middle of the trading day than at the beginning and end of the day.
While these empirical irregularities provide for interesting conversation, it is not clear that any of them can be exploited to earn excess returns.
The January Effect
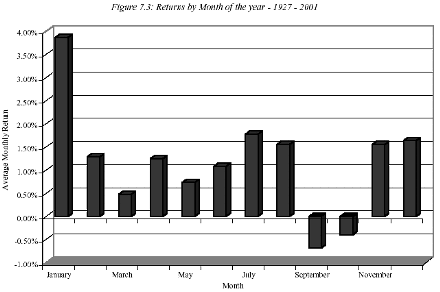
Studies of returns in the United States and other major financial markets consistently reveal strong differences in return behavior across the months of the year.
Returns in January are significantly higher than returns in any other month of the year. This phenomenon is called the year-end or January effect, and it can be traced to the first two weeks in January.
The January effect is much more accentuated for small firms than for larger firms, and roughly half of the small firm premium, described in the prior section, is earned in the first two days of January.
Returns in January

Prof. Aswath Damodaran
Next: Explanations for the January Effect
Summary: Index